Consulting
I provide three main types of consulting services: statistical consulting, data visualization, and academic website development.
If you’re interested in learning more about how I can assist with your projects or if you have questions or require advice, please don’t hesitate to reach out. I offer a free 20-minute consultation to discuss your specific needs and determine how I can best support you. To schedule this consultation, feel free to contact me at [email protected]. I will be pleased to support you every step of the way.
Statistical Consulting Services
I offer a wide array of services designed to cater to a broad spectrum of statistical needs, whether you’re an academic or part of the industry. Here’s a detailed list of the services I provide:
- Meta-analysis
- Data-analysis
- Data cleaning and management
- Statistical Modeling
- Statistical Software
- Psychometrics and Structural Equation Modeling
- R Programming
- Computationally Reproducible and Self-Contained Manuscripts
I’ve structured my pricing to accommodate different client types, ensuring a transparent and cost-effective approach. The current hourly rates are as follows:
| Client Type | Rate |
|---|---|
| Non-Academic (Industry) | $150/hr |
| Academic | $130/hr |
| Student | $90/hr |
Projects with a substantial scope (i.e., more than 20 hours worth of consulting work) can be structured so that their pricing will be done on a per-project rather than a per-hour basis.
Data Visualization Services
I can help you prepare high-quality data visualizations for academic publications, websites, slideshows, etc. There are two types of data visualizations that I provide: stand-alone diagrams and computationally reproducible figures.
To ensure that your specific needs are met, you can either send me a detailed description of the desired diagram via email ([email protected]) with the following information:
- What kind of figure do you need?
- When do you realistically need to have it ready by?
- Do you have all the information needed to produce the figure?
- Could you provide an example of a figure you are trying to emulate?
Then we can set up a free 20-minute virtual meeting to discuss the details further.
Diagrams
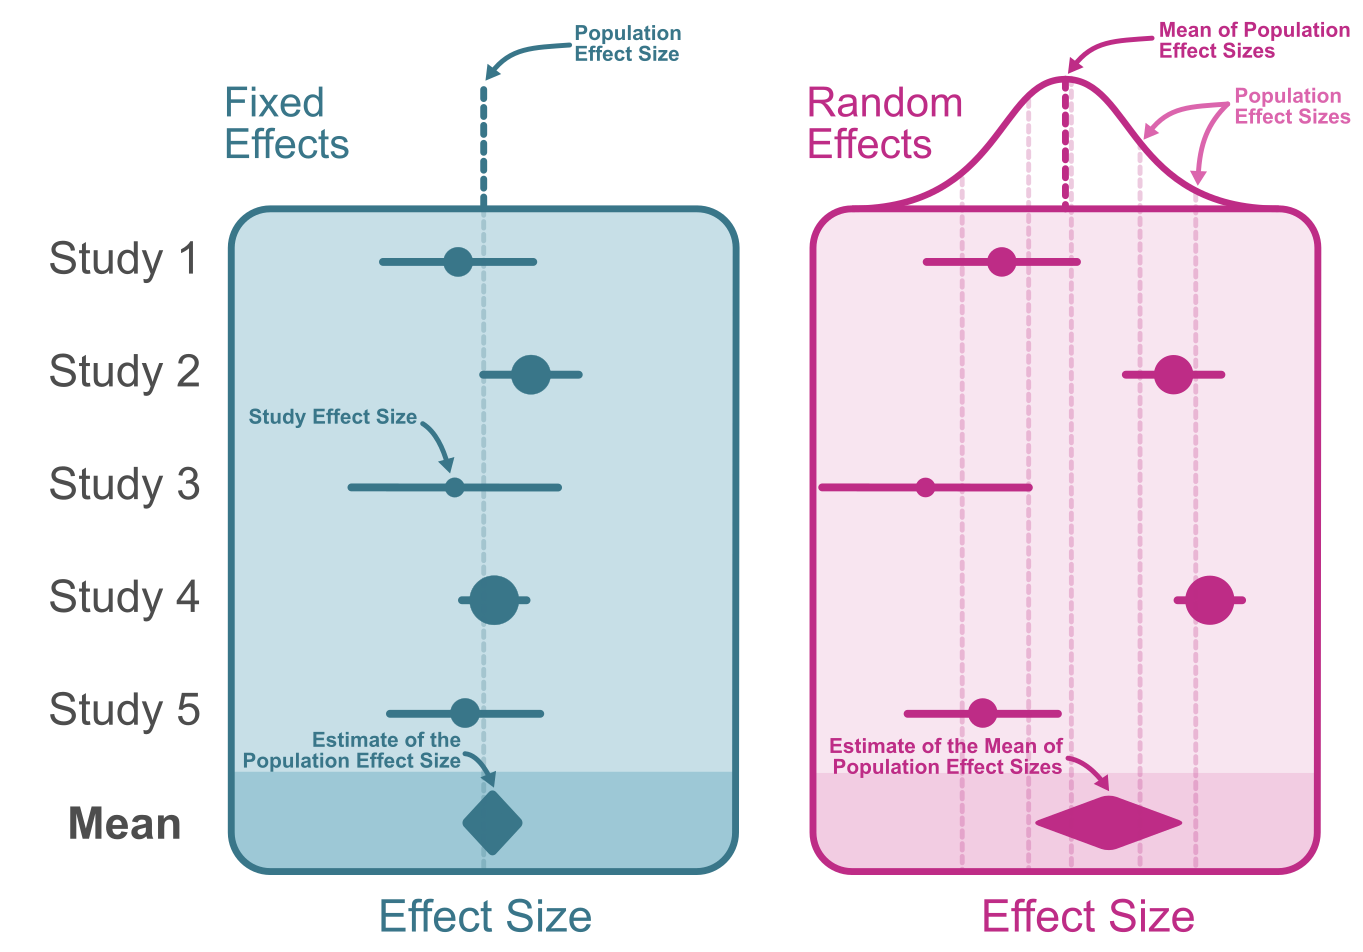
Stand-alone diagrams are used as visual representations of a scientific concept. Each diagram I produce will be made available as a high-resolution PNG, JPEG, and SVG file. For your convenience I included an example of my work below .
| Client Type | Rate |
|---|---|
| Non-Academic (Industry) | $150/diagram |
| Academic | $120/diagram |
| Student | $80/diagram |
Computationally Reproducible Figure Panels
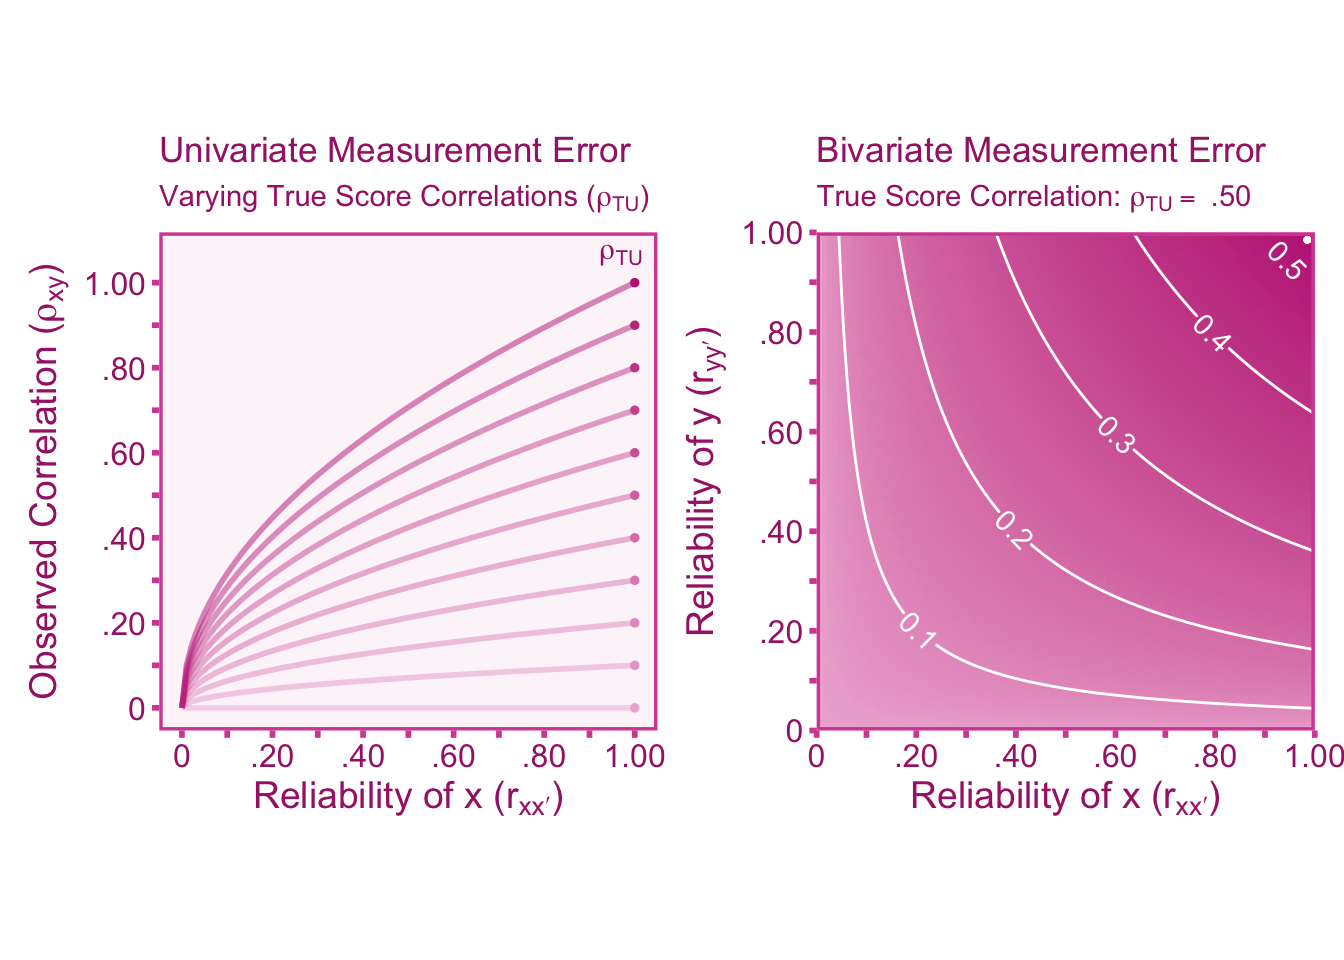
I can also help you generate figure panels that contain real or simulated data. For each panel, my service ensures that you will receive the final visual representation (as a high-resolution PNG or JPG), but also an R script containing the code for reproducing the figure. For your convenience, I’ve included examples of my work, showcasing both a two-panel figure (top) and a single-panel figure (bottom).
| Client Type | Rate |
|---|---|
| Non-Academic (Industry) | $150/panel |
| Academic | $130/panel |
| Student | $100/panel |
Academic Websites Powered by Quarto
I can help you create your own academic/personal website powered through Quarto. Websites can be published through Quarto Pub or Github pages. For an example, my website matthewbjane.com is entirely created through Quarto. Below are some base packages that you can start with, however prices may vary if features are added or removed from these base packages:
| Features | Rate |
|---|---|
| Home Page + CV + Blog + Favicon/Banner/Logo | $1,100 |
| Home Page + CV + Blog | $800 |
| Home Page + CV | $550 |
Testimonials
Velu Immonen, Graduate Student at Solent University:
With Matthew’s expert guidance, I navigated through my first meta-analysis with success. His support in effect size selection, model specification, and data visualisation proved indispensable. It felt like having ChatGPT on your ear, with the distinction that Matthew actually offered up-to-date best practices without making up citations – not to mention the human conversation. This service provided me with clarity and considerable time savings. I wholeheartedly endorse it for anyone delving into the world of meta-analysis.
Alysson Enes, Graduate Student at Federal University of Paraná:
Matthew helped me with a data visualization service. I spent weeks trying to solve a code in a figure, but I couldn’t find the solution. When I contacted Matthew, we had an initial meeting where he was extremely helpful in solving my problem. Matthew quickly sent me a guide with a full explanation of the problem, including how I could use the data visualization on other datasets. I recommend Matthew’s work to anyone who is having problems with data visualization.