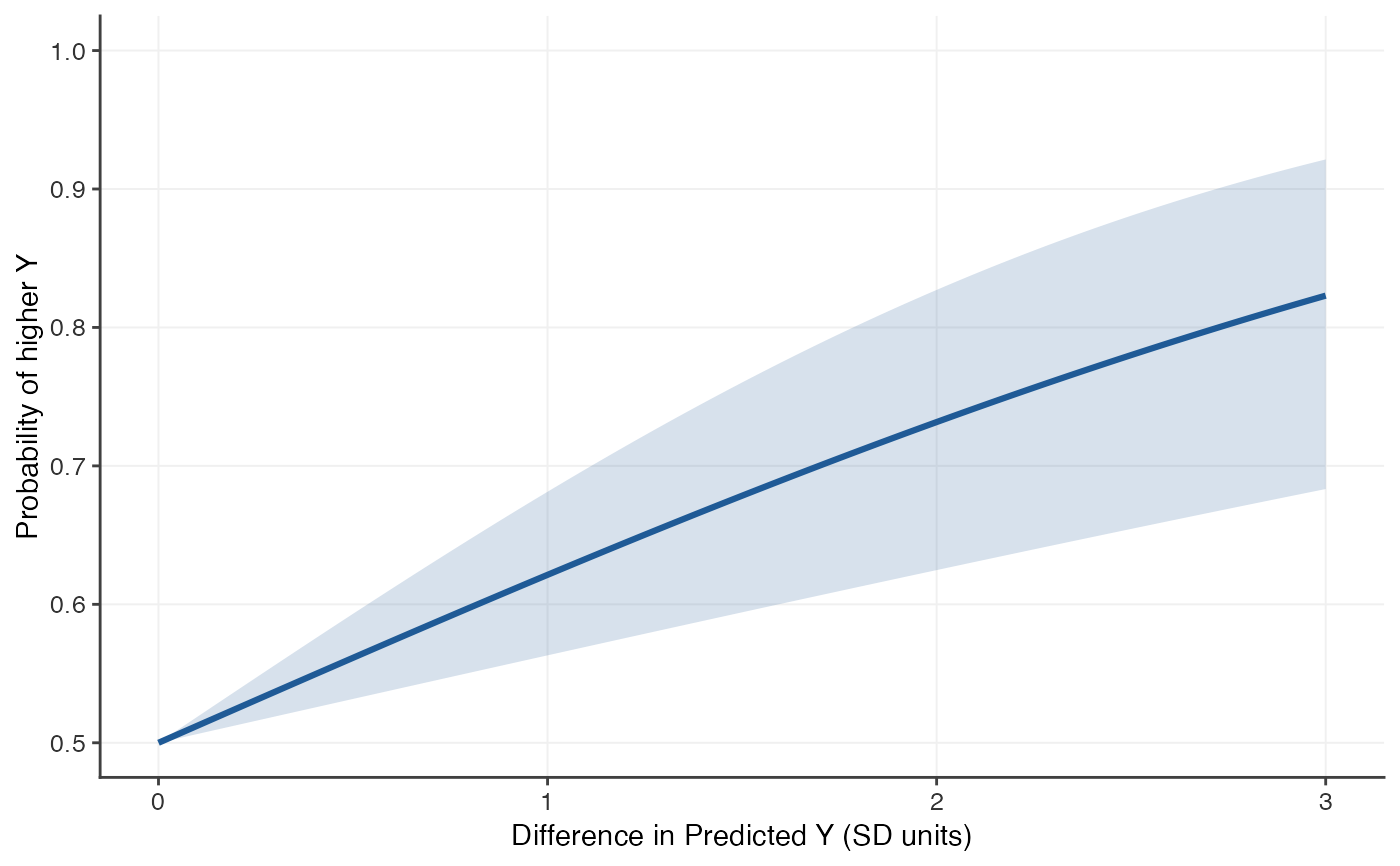
Computes the probability of outcome superiority curve for the optimally weighted (regression) composite of several predictors, from a correlation matrix.
Usage
posc_multi(
  r_mat,
  n,
  outcome = ncol(r_mat),
  adjust = TRUE,
  level = 0.95,
  max_delta = 3,
  predictor_name = "Predicted Y",
  outcome_name = NULL,
  outcome_idx = NULL
)
Arguments
- r_mat
Correlation matrix of the predictors and the outcome.
- n
Sample size used to estimate
r_mat.- outcome
Row/column of
r_matholding the outcome, as an index or a name. Defaults to the last one.- adjust
Use the adjusted multiple correlation? See Details.
- level
Confidence level of the band.
- max_delta
Largest difference in the composite (in SD units) to evaluate.
- predictor_name, outcome_name
Labels used in printed output and plots.
outcome_namedefaults to the outcome's name inr_mat, if it has one.- outcome_idx
Deprecated; use
outcome.
Value
An object of class "posc": a list with elements
- curve
data frame with columns
delta,p,lower,upper, over a symmetric grid of differences.- method, r, n, level, sd_x, max_delta, labels, details
information about how the curve was computed.
Details
The composite that best predicts the outcome correlates with it at the
multiple correlation
$$R = \sqrt{\mathbf{r}_{xy}^\top \mathbf{R}_{xx}^{-1} \mathbf{r}_{xy}},$$
where \(\mathbf{R}_{xx}\) is the predictor intercorrelation matrix and
\(\mathbf{r}_{xy}\) the predictor-outcome correlations. The POSC is then
computed as in posc_uni(), with differences in the composite expressed in
its standard-deviation units.
A sample multiple correlation is biased upwards as an estimate of the
population multiple correlation, because the weights are fitted to the same
sample. With adjust = TRUE (the default) \(R\) is replaced by the
square root of the adjusted \(R^2\),
\(1 - (1 - R^2)(n - 1)/(n - k - 1)\) for \(k\) predictors, which
corrects most of this bias. (How well weights estimated in this sample
would predict in a new sample is lower still.)
The confidence band uses a Fisher-\(z\) interval for \(R\) with standard error \(1/\sqrt{n - k - 2}\), truncated at zero, and should be treated as approximate.
See also
posc_lm() to start from a fitted linear model instead.
Examples
r_mat <- matrix(c(1.0, 0.4, 0.3, 0.2,
                  0.4, 1.0, -0.3, 0.2,
                  0.3, -0.3, 1.0, 0.3,
                  0.2, 0.2, 0.3, 1.0), 4, 4,
                dimnames = list(c("X1", "X2", "X3", "Y"),
                                c("X1", "X2", "X3", "Y")))
fit <- posc_multi(r_mat, n = 100, outcome = "Y")
fit
#> Probability of Outcome Superiority Curve
#>   Method:    bivariate normal, optimally weighted composite
#>   Predictor: Predicted Y    Outcome: Y
#>   r = 0.400, 95% CI [0.219, 0.555], n = 100
#>   (r adjusted for the number of predictors; unadjusted r = 0.431)
#>
#>   P(higher Y | Predicted Y higher by delta):
#>  delta     p lower upper
#>  0.500 0.561 0.532 0.593
#>  1.000 0.621 0.563 0.681
#>  2.000 0.732 0.625 0.827
plot(fit)