
Computes the probability of outcome superiority curve implied by a correlation between a predictor and an outcome, assuming the two are bivariate normal.
Usage
posc_uni(
  r,
  n = NULL,
  sd_x = 1,
  level = 0.95,
  max_delta = 3 * sd_x,
  predictor_name = "X",
  outcome_name = "Y"
)
Arguments
- r
Correlation between predictor and outcome, in \((-1, 1)\).
- n
Sample size used to estimate
r. Needed for the confidence band; useNULLto draw the curve without one.- sd_x
Standard deviation of the predictor. The curve is expressed in the predictor's units; the default
1gives standard-deviation units.- level
Confidence level of the band.
- max_delta
Largest difference in the predictor to evaluate. Defaults to 3 standard deviations of the predictor.
- predictor_name, outcome_name
Labels used in printed output and plots.
Value
An object of class "posc": a list with elements
- curve
data frame with columns
delta,p,lower,upper, over a symmetric grid of differences.- method, r, n, level, sd_x, max_delta, labels, details
information about how the curve was computed.
Details
If \(X\) and \(Y\) are bivariate normal with correlation \(r\), then
for two randomly chosen people whose predictor scores differ by \(\Delta\)
$$P(Y_1 > Y_2 \mid X_1 - X_2 = \Delta) =
\Phi\left(\frac{r\,\Delta / \sigma_X}{\sqrt{2(1 - r^2)}}\right),$$
where \(\Phi\) is the standard normal distribution function and
\(\sigma_X\) the standard deviation of the predictor. Set sd_x to put
\(\Delta\) on the raw scale of the predictor; the default sd_x = 1
gives differences in standard-deviation units.
The curve is monotone in \(r\), so the pointwise confidence band is obtained by evaluating it at the limits of the Fisher-\(z\) confidence interval for \(r\).
See also
posc_emp() for a curve estimated from raw data without assuming
normality; posc_comp() to compare curves.
Examples
# Differences in SD units
fit <- posc_uni(r = 0.5, n = 100)
fit
#> Probability of Outcome Superiority Curve
#> Method: bivariate normal
#> Predictor: X Outcome: Y
#> r = 0.500, 95% CI [0.337, 0.634], n = 100
#>
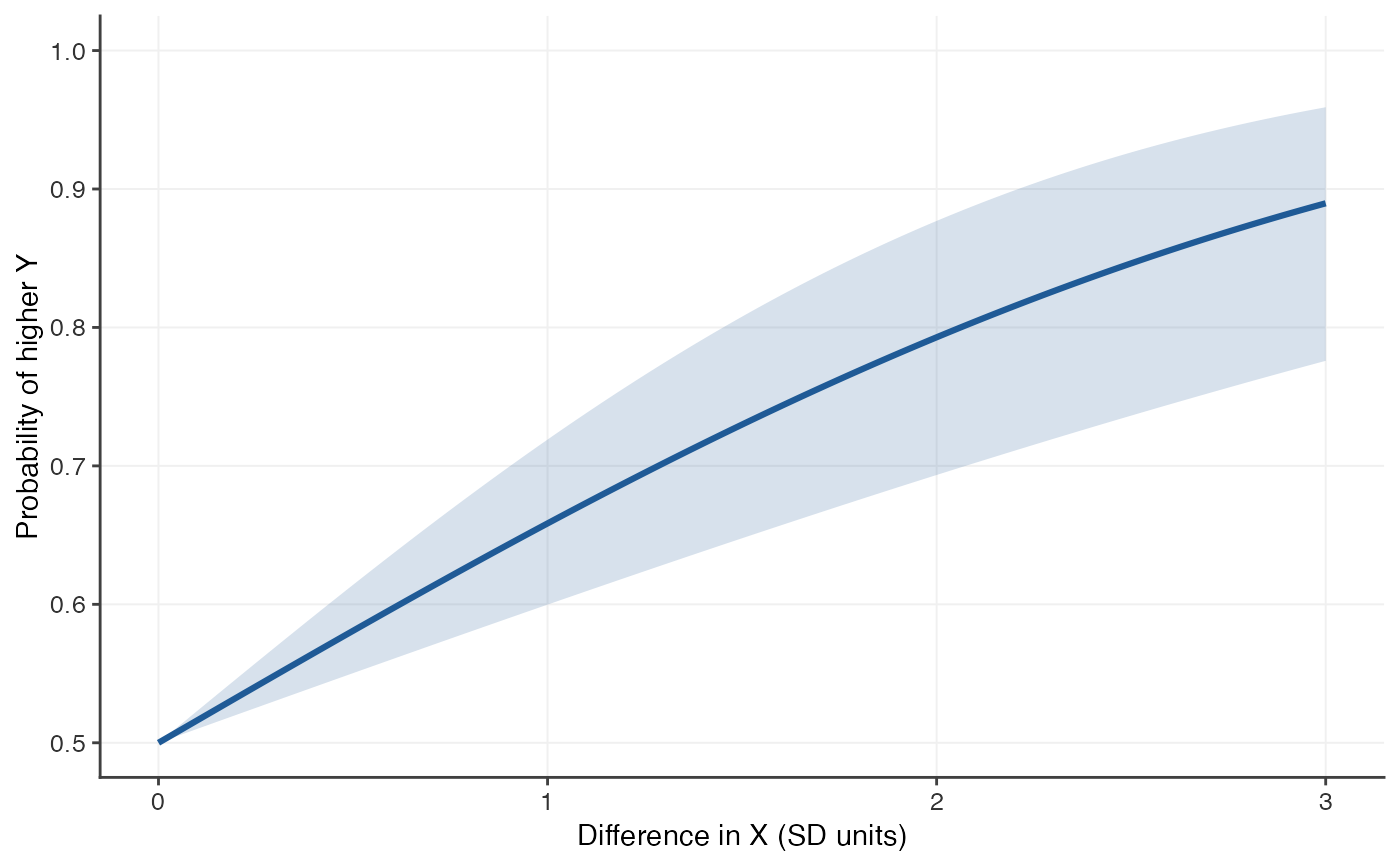
#> P(higher Y | X higher by delta):
#> delta p lower upper
#> 0.500 0.581 0.550 0.614
#> 1.000 0.658 0.600 0.719
#> 2.000 0.793 0.693 0.877
plot(fit)
 # Raw units: an IQ test with SD = 15
iq <- posc_uni(r = 0.5, n = 100, sd_x = 15, predictor_name = "IQ",
outcome_name = "job performance")
predict(iq, delta = c(5, 15, 30))
#> delta p lower upper
#> 1 5 0.5541221 0.5335775 0.5766406
#> 2 15 0.6584543 0.5997878 0.7190156
#> 3 30 0.7928919 0.6934299 0.8769429