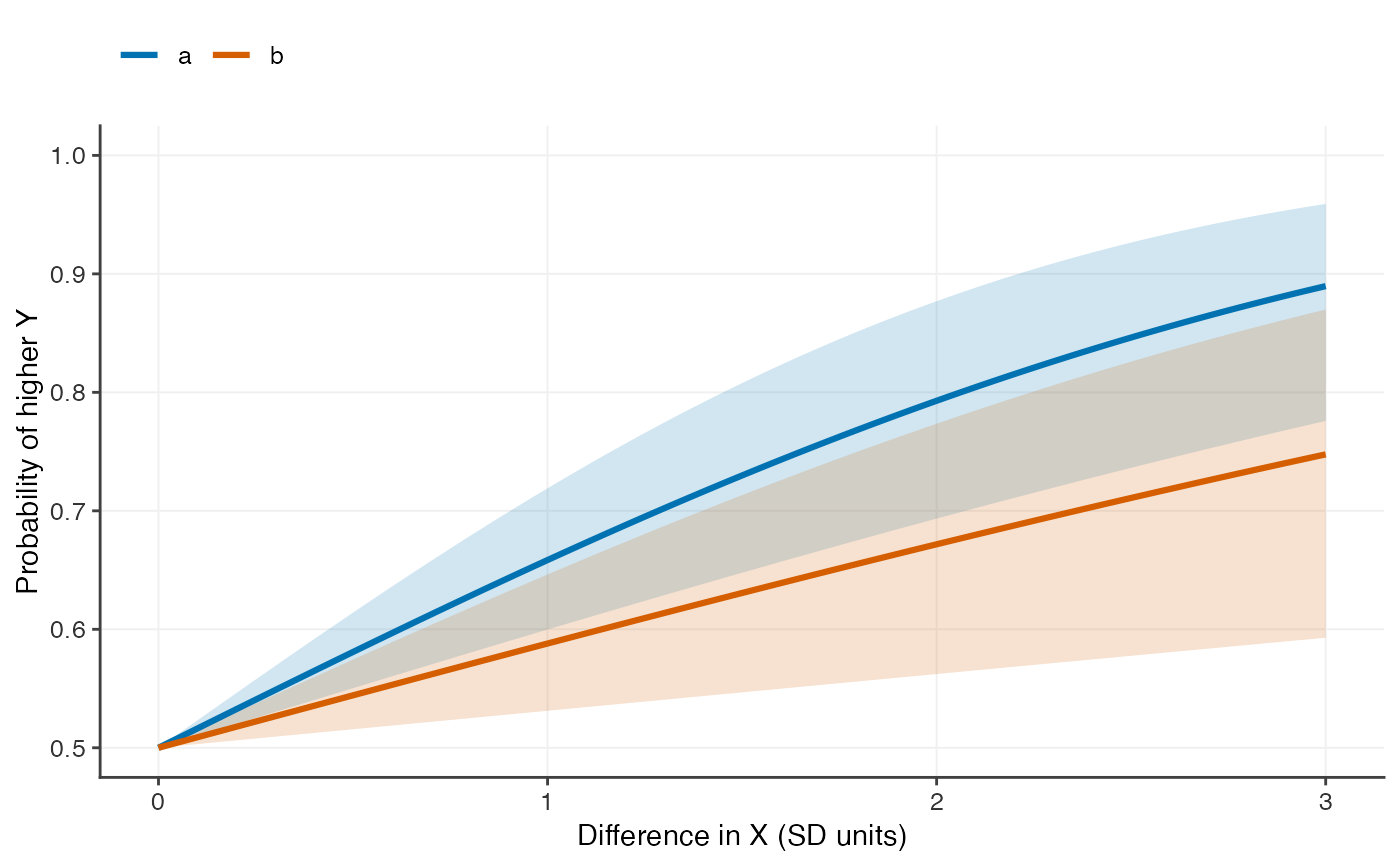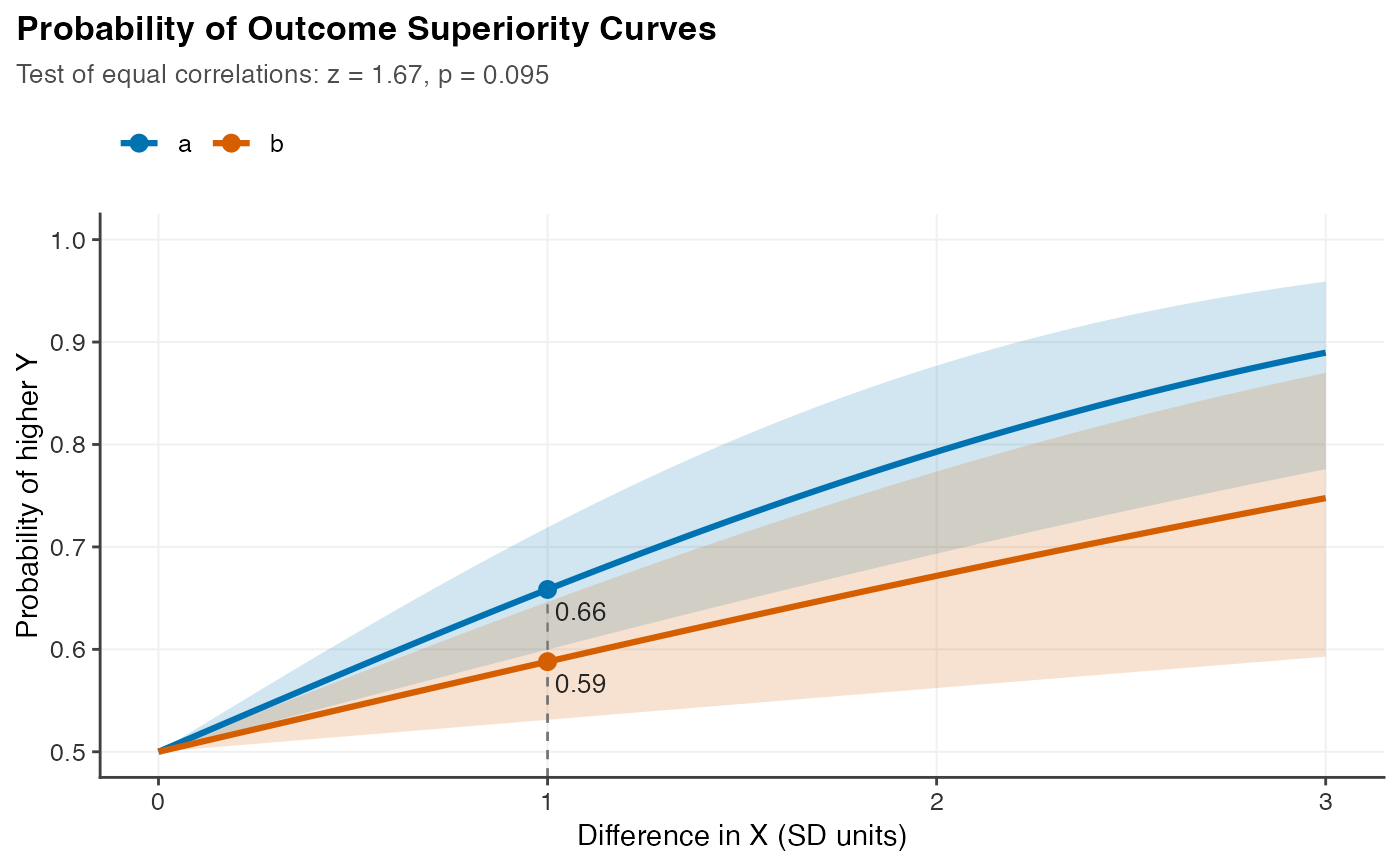
Plot a comparison of POSCs
Arguments
- object, x
A
"posc_comparison"object fromposc_comp().- full
Plot the full sigmoid over negative and positive differences?
- colors
Colours for the curves, one per curve. Defaults to a colour-blind-safe palette.
- ci
Draw confidence bands (where available)?
- percent
Label the probability axis as percentages instead of probabilities?
- grid
Draw light gridlines?
- mark, mark_ci
Differences in the predictor to highlight on every curve, and whether to add confidence intervals to their labels; see
autoplot.posc().- title, subtitle
Plot title and subtitle. None by default; supply a string, or
TRUEfor an automatic one (the subtitle then reports the test of equal correlations).- ...
Passed from
plot()toautoplot().
Value
autoplot() returns a ggplot object; plot() returns it
invisibly.